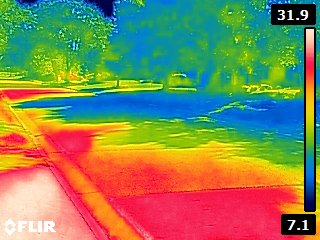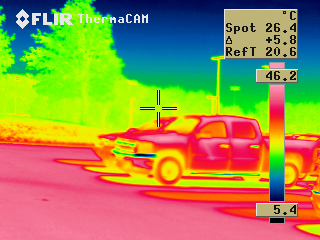
When Kassel University and Dr. Sanda Lenzholzer mapped the urban climate of Arnhem, Netherlands, they identified several 'hot spots'. The red splotches on the map indicate places where people would be overheated on summer days.

Urban climate map of Arnhem, Netherlands
Sanda was not satisfied with simply identifying hot spots - she wanted to do something to make them cooler. An analysis of the microclimate of these locations identified some typical urban heat island (UHI) problems: too many hard surfaces and too few trees.
The red area outlined with a pink ring on the map is a densely populated area centred on the Graaf Ottoplein square (below) that is almost devoid of trees. Sanda wondered how she could get more trees growing in that neighbourhood. She also wondered if there was some way to do it while educating the public as to the microclimatic value of trees in urban areas so that they might also take action around their own houses.

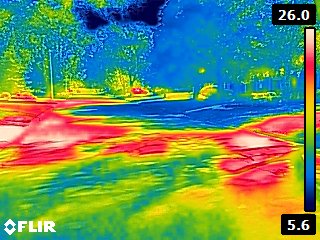
Google Earth image of Graaf Ottoplein, Arnhem
It is well known that trees have many microclimate-modifying characteristics. They intercept solar radiation before it reaches the ground which means cooler surface temperatures in the shade of trees and consequently less terrestrial radiation emitted by these surfaces. Evapotranspiration from their leaves humidifies and cools the air. The cumulative effect of many trees means that urban areas with a larger amount of tree cover are cooler and more thermally comfortable than areas with few trees and a large amount of hard surfaces. Furthermore trees can filter fine dust from the air and remove carbon dioxide from the air. Trees have many benefits for urban climate!
Sanda describes their thinking. "We wanted to raise more awareness of people for these benefits of trees on urban climate. We think that is important that people know the role that trees play in providing more pleasant microclimatic environments in cities. And because nobody in the Netherlands or elsewhere has raised awareness for the important role that trees play in urban climate before in a very explicit way, we wanted to be the first to do so."
So she collaborated with some creative friends and designers, and they came up with a unique idea.
"We inaugurated the world’s first ‘urban climate tree’. The ‘urban climate tree’ is a young Sophora japonica tree that was planted on Graaf Ottoplein square. This square lies in the middle of the neighbourhood that has heat problems and thus was an ideal location to demonstrate the positive effects of a tree. Apart from that, the square itself also has too many stony surfaces that add to the heat problems, and thus needs more trees. The ‘urban climate tree’ itself is surrounded by a ring shaped piece of art made from Cor Ten steel that explains the role of a tree on urban climate. Translated from Dutch it says: ‘tree=coolness= fresh air= wind protection=urban climate=’ The text on the ring can thus be read in a loop emphasizing that all these benefits are always connected with each other."
And they made it into a celebration. Dr. Lenzholzer continues "The inauguration ceremony was opened by the inventor of the ‘urban climate tree’ idea, Frans Tak, followed by a brief introduction that I gave on the role of trees on urban climate. Then the alderman Henk Kok unveiled the ring around the tree and highlighted the role of trees for urban climate in the neighbourhood where it is placed. And last but not least, he emphasized how proud he is of having the world’s first urban climate tree in the city of Arnhem."

Photo credit: Han Koppers
"After the inauguration ceremony we held a mini-symposium in the neighbourhood centre where local speakers gave presentations about the importance of trees and greenery on urban climate. They showed what can be done in such a densely built- up area as the neighbourhood that is now home to the world’s first urban climate tree. "
Sanda Lenzholzer (left) with the urban climate tree. Photo Credit: Han Koppers
It's very fitting that one of the common names for the Sophora japonica is Scholar tree. Clearly scholars are doing something very good for the urban microclimate of Arnhem and hopefully the initiative will spread into an urban climate forest around the world.